Appearance
Orders Report
The Orders Report in FluentCart provides in-depth analytics specifically focused on your store's order performance. This report allows you to analyze various aspects of your sales data, helping you understand trends, customer behavior, and fulfillment efficiency.
Accessing the Orders Report
Go to WordPress dashboard, navigate to FluentCart Pro > Reports.
Click on the "Orders" tab to access the Orders Report.
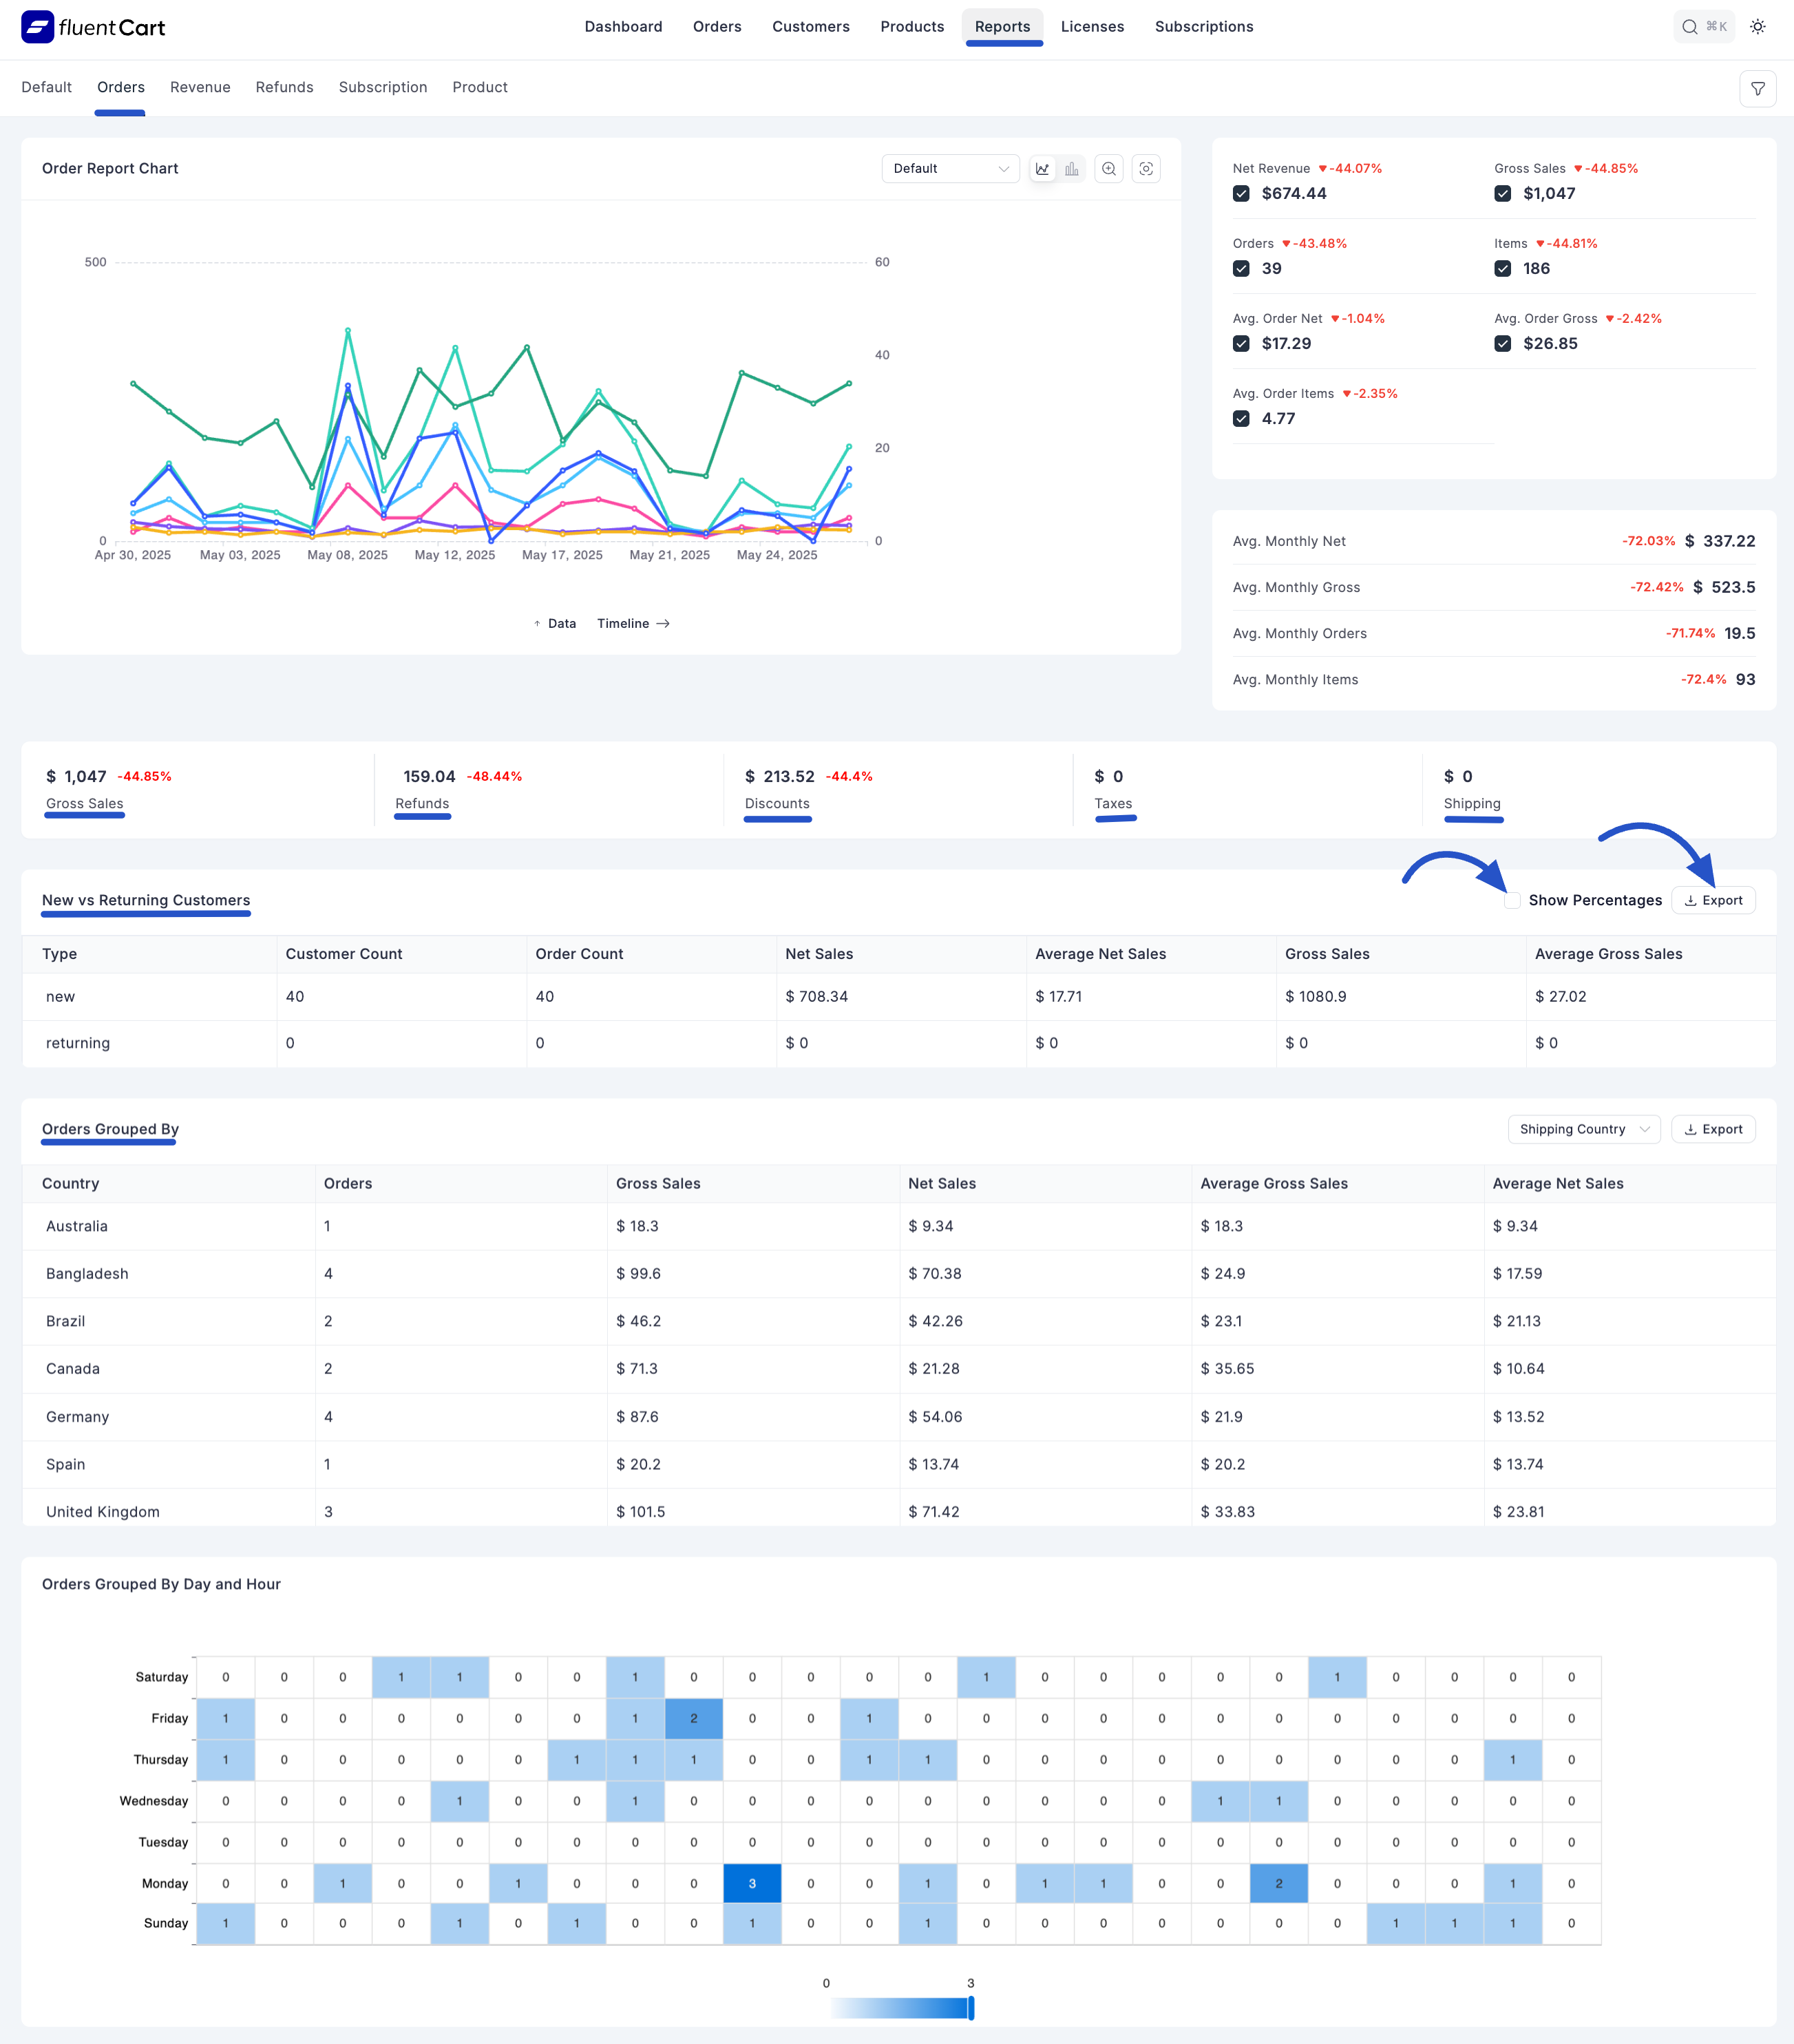
Order Report Chart
This chart visually represents order trends over time.
- Timeline Options: You can view data on a "Monthly" or "Yearly" timeline.
- Metrics Displayed: Typically tracks "Net Revenue", "Gross Sales", and "Orders" over the selected period.
Key Order Performance Indicators
The top section of the Orders Report provides a summary of crucial order-related metrics:
- Gross Sale: The total value of sales before any refunds or discounts.
- Refunded: The total monetary amount that has been refunded from orders.
- Discount The total monetary amount that has been discounted from orders.
- Taxes: The total amount of taxes collected on orders.
- Shipping: The total amount collected for shipping on orders.
New vs. Returning Customers
This section provides insights into the behavior of your new and returning customers for orders.
- Customer Count: The number of new or returning customers.
- Order Count: The number of orders placed by new or returning customers.
- Net Sales: The net sales generated by new or returning customers.
- Average Net Sales: The average net sales per order for new or returning customers.
- Gross Sales: The gross sales generated by new or returning customers.
- Average Gross Sales: The average gross sales per order for new or returning customers.
- "Show Percentages" Toggle: Check this checkbox of "Show Percentage" that allows you to view these metrics as percentages.
- Export: Click the Export button to download Order Report CSV file.
Orders Grouped By
This section breaks down order data based on specific criteria, offering granular insights.
1. Shopping Country
- Presents a table showing "Country," "Orders," "Gross Sales," "Net Sales," "Average Gross Sales," and "Average Net Sales" for orders grouped by the customer's shopping country.
2. Day and Hour
- Provides a table showing "Orders Grouped By Day and Hour", allowing you to analyze sales performance based on specific days of the week and hours of the day.
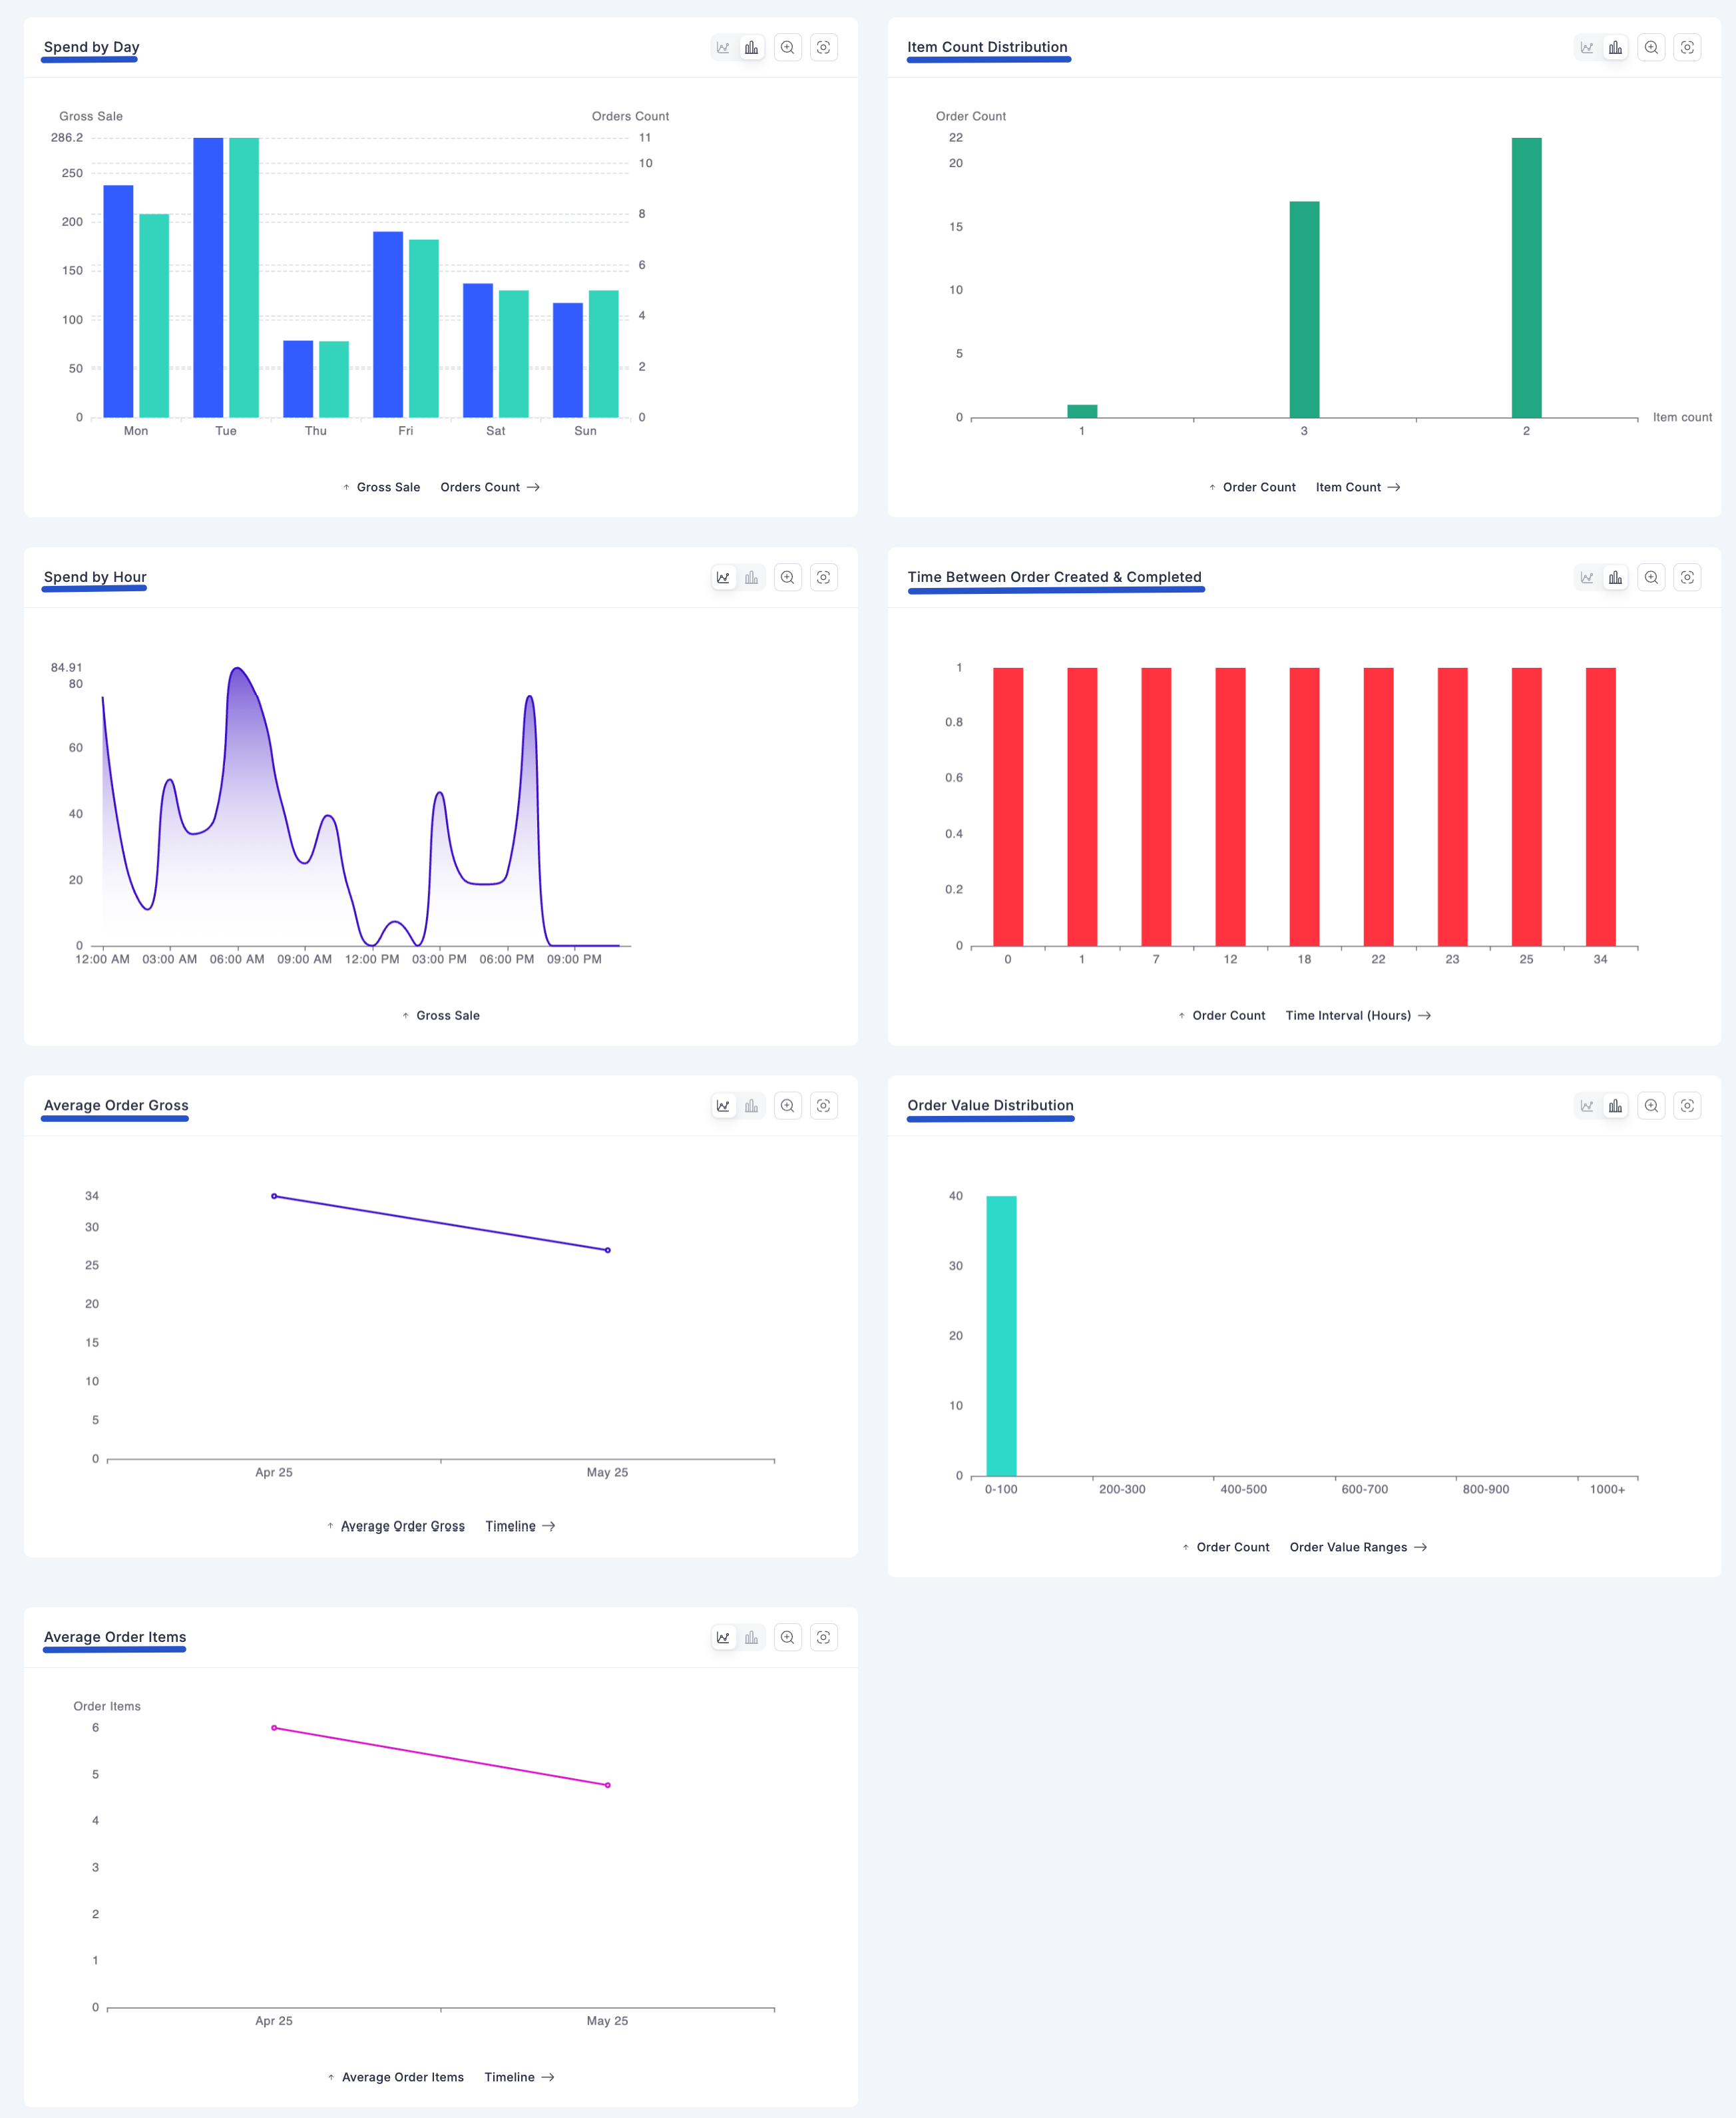
Additional Order Analytics
The report also includes various other charts and data visualizations for in-depth analysis:
- Spent by Day: Visualizes customer spending patterns categorized by day.
- Item Count Distribution: Shows the distribution of product counts within orders.
- Spend by Hours: Visualizes customer spending patterns categorized by hour.
- Time Between Order Created & Completed: Helps analyze the efficiency of your fulfillment process.
- Order Value Distribution: Displays the distribution of order values across different ranges.
- Average Order Gross Timeline: Tracks the average gross value of orders over time.
- Average Order Items Timeline: Tracks the average number of items per order over time.
Navigating to All Orders
- A "View All Orders" link is typically available, allowing you to quickly navigate to the main Orders Management screen for more detailed order information.